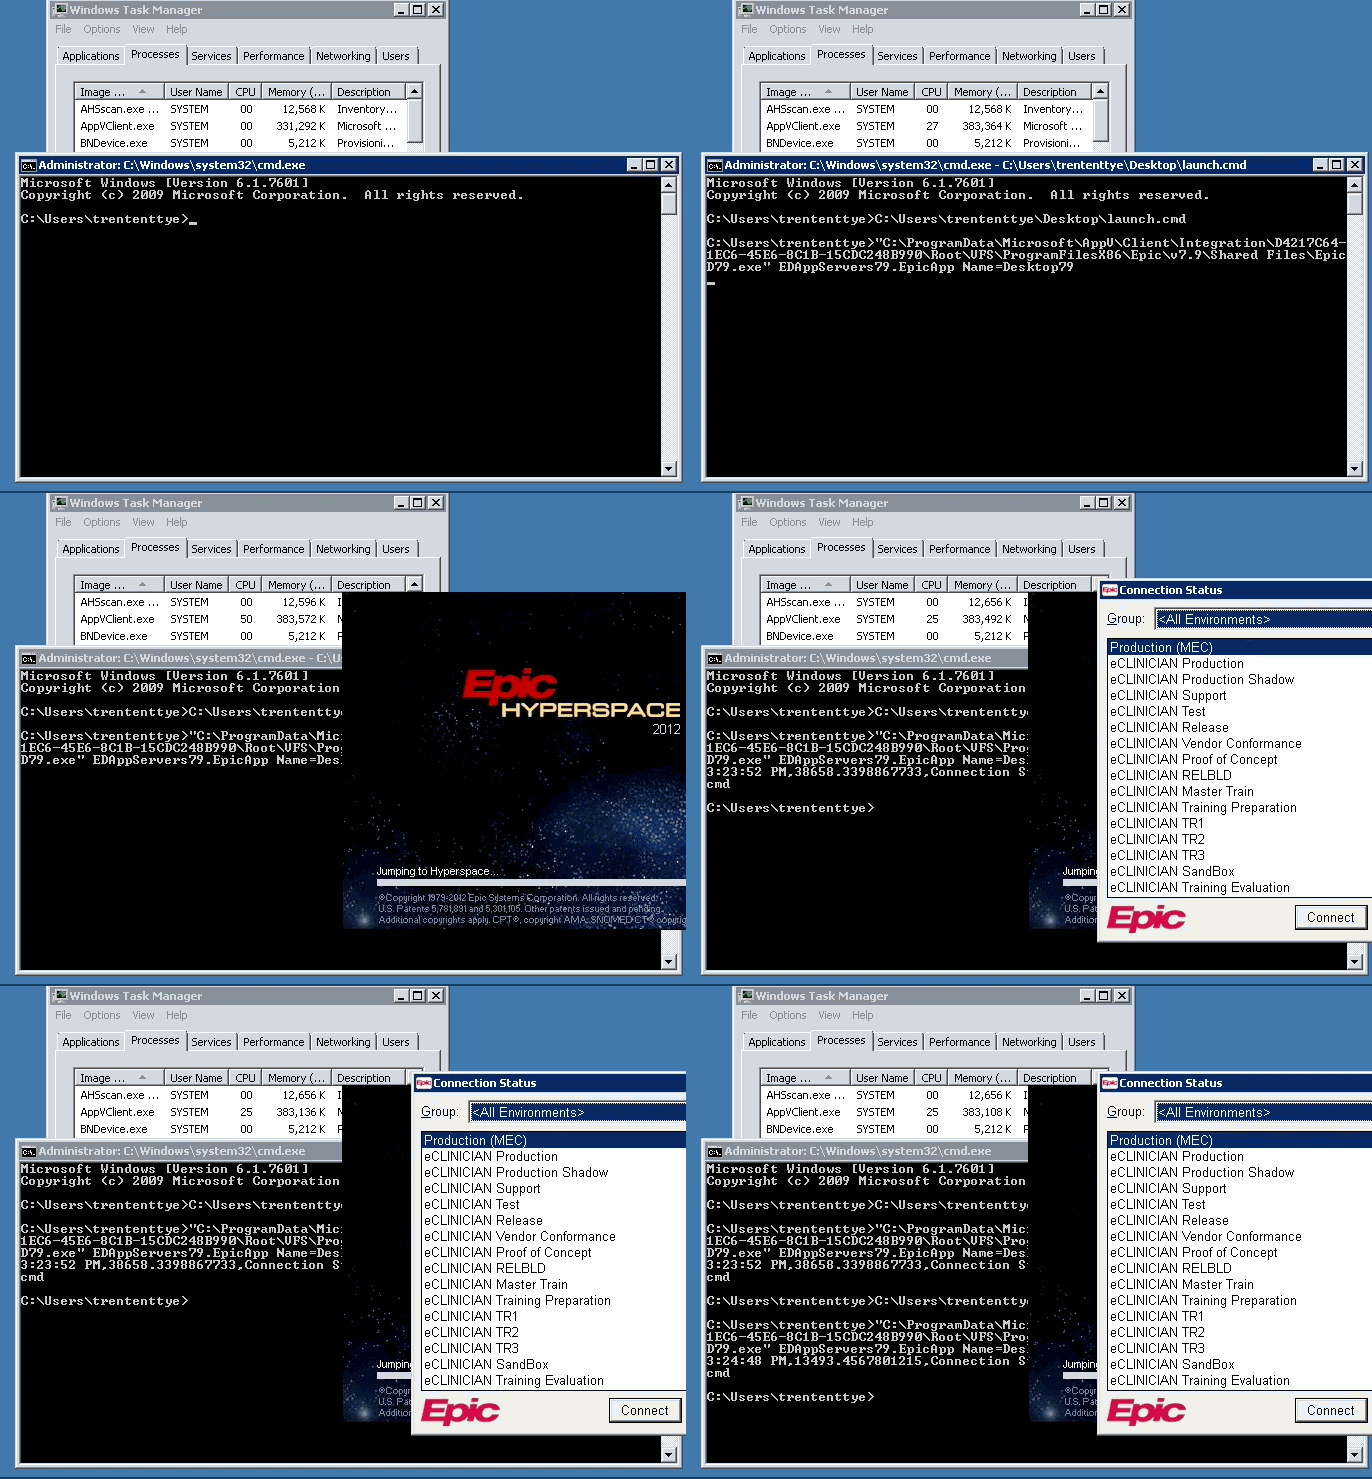
Because of some performance concerns with the Shared Content Store (SCS) I was tasked with coming up with a way of determining if there is a performance impact of switching from fully mounted applications. In order to determine the impact my plan was to measure a baseline based on disk performance. Our SMB share that we are storing our .appv packages actually has the same performance as the local disk. Since AppV packages are immutable, the only performance consideration we should be concerned is READ performance from the SMB share compared to the local disk. The writes occur in the %userprofile%\appdata\vfs which is stored on the C:\ drive. The Cache to RAM with disk overflow feature would ensure that write performance into those directories are fast and should be near instant.
With that said, I've used the diskspd.exe application (new from Microsoft) to measure performance. AppV 5 utilizes a 64KB allocation size so that's what we'll set as our -b value. We'll measure Latency statistics comparing local disk to the file share as well.
D:\diskspd.exe -c1G -b64K -L -d60 D:\test.dat
D:\diskspd.exe -c1G -b64K -L -d60 \\citrixnas01\ctx_images_test\test.dat
Results:
D:
SMB share:
Read IO
thread | bytes | I/Os | MB/s | I/O per s | AvgLat | LatStdDev | file
-----------------------------------------------------------------------------------------------------
0 | 83828801536 | 1279126 | 1332.13 | 21314.08 | 0.045 | 0.138 | D:\test.dat (1024MB)
-----------------------------------------------------------------------------------------------------
total: 83828801536 | 1279126 | 1332.13 | 21314.08 | 0.045 | 0.138
SMB:
Read IO
thread | bytes | I/Os | MB/s | I/O per s | AvgLat | LatStdDev | file
-----------------------------------------------------------------------------------------------------
0 | 80124379136 | 1222601 | 1273.26 | 20372.15 | 0.096 | 0.105 | \\citrixnas01\citrix_test\test.dat (1024MB)
-----------------------------------------------------------------------------------------------------
total: 80124379136 | 1222601 | 1273.26 | 20372.15 | 0.096 | 0.105
Performance of the SMB share vs local disk:
MB/s: 96%
IO per s: 96%
AvgLat: 46%
Based on these results, the local disk appears to be nearly identical to the SMB share with the average latency a little more than half on the local disk. Although it's half on average, we are still in the sub 1ms time range which is significantly faster than you could get with a physical server with a single local disk.
The next test I have is launching an application and getting to the splash screen to see how long it takes to load. For this test I've written a AutoIt script that takes two parameters, the name of the program to launch and the window title to monitor for.
#Region ;**** Directives created by AutoIt3Wrapper_GUI ****
#AutoIt3Wrapper_Change2CUI=y
#EndRegion ;**** Directives created by AutoIt3Wrapper_GUI ****
;
; AutoIt Version: 3.0
; Language: English
; Platform: Win9x/NT
; Author: Trentent Tye (trentent@ca.ibm.com)
;
; Script Function:
; This script takes 2 parameters. The first is the program to launch; second is the window we wait for then output
; standard output with the duration both took.
#include
$progToLaunch = $CmdLine[1]
$windowToWaitFor = $CmdLine[2]
Local $hTimer = TimerInit()
Run($progToLaunch)
WinWaitActive($windowToWaitFor)
Local $fDiff = TimerDiff($hTimer)
Local $Time = _NowTime()
ConsoleWrite($Time & "," & $fDiff & "," & $windowToWaitFor & "," & $progToLaunch & @CRLF)
;finished
I setup a cmd file with my program (Epic) because it takes some parameters prior to launch. I then pointed my timer application at it.
C:\timer.exe D:\AppVPerfTest\epic.cmd "Connection Status"
The results (with SCS):
Net Stop / Net Start AppvClient
10:05:20 AM,196229.360505316,Connection Status,D:\AppVPerfTest\epic.cmd
10:05:51 AM,13964.6012970922,Connection Status,D:\AppVPerfTest\epic.cmd
10:05:59 AM,12841.0388750526,Connection Status,D:\AppVPerfTest\epic.cmd
10:06:03 AM,12334.0792614704,Connection Status,D:\AppVPerfTest\epic.cmdThe columns are Time Completed, Duration (in ms), Window to check for, Command executed.
After doing a Net Stop AppvClient / Net Start Appclient and then executing our AppV application it takes 196 seconds to start the application. After that initial launch it takes 12-15 seconds to start. Something is really dragging our initial application launch time down. I've found if I stop/start the service I need to do a add/publish via Powershell for that application to reduce the 196 seconds. This then takes first launch down to 48 seconds. This is how long is takes to start the same application after a system restart:
3:25:41 PM,48195.8385074081,Connection Status,D:\AppVPerfTest\epic.cmd
3:27:26 PM,12646.0290344164,Connection Status,D:\AppVPerfTest\epic.cmd
3:27:45 PM,15450.5886222970,Connection Status,D:\AppVPerfTest\epic.cmd
3:28:00 PM,12488.5766906129,Connection Status,D:\AppVPerfTest\epic.cmd
The application I'm testing this with is Epic. It's a huge application. AppXManifest is 72MB, FilesystemMetaData.xml is 1.7MB, Registry.Dat is 62MB.
It contains 22,000 files totalling around 2GB in size.
When AppV is "launching" the application for the first time it starts consuming memory and CPU for the 196 seconds that it's launching, peaking at nearly 600MB RAM and 50% CPU (though most of the time it's peaked at 25% CPU).
| AppV utilization before application launch |
 |
| Start of application launch |
 |
| Peak during launch |
 |
| Application launched |
 |
| I launched the application at 12:36:24, it finally displayed the GUI at 12:39:38 |
The only log that shows data during the entire time is the SHARED PERFORMANCE log. Unfortunately, the log is undecipherable to me.
Lots of PreCreate, PreCleanup, PreAcquireForSection with no relevant data.
Perfmon.exe doesn't do a whole lot better with large gaps between file/process/network accesses:
 |
| What is it doing between 1:17:41 and 1:18:29? CPU is pegged but no disk activity |
Showing Registry accesses also shows huge gaps between the AppVClient.exe process accessing the system.
 |
| Registry information still shows huge gaps in time where the AppVClient.exe is processing |
First launch delay when stopping/restarting AppV service.
Total time is 221s for the first launch, 15s for subsequent launches
Total time is 221s for the first launch, 15s for subsequent launches
First launch delay when starting application after a full system restart.
Total time is 38s for first launch then 13s for subsequent launches.
Total time is 38s for first launch then 13s for subsequent launches.


No comments:
Post a Comment